What is a kilowatt hour in real life terms?
Cross posted from baloghblog:
I thought that some of the residents of the west side and readers of the geddesblog would appreciate this post. As winter is upon us, and we begin to dread the
Did you ever wonder what that kWh stood for on your bill, or what 1 kwh was the equivalent of? Here is a primer for you: (more ideas HERE and HERE)
Unplugged living has a good post about what that little "kWh" from your energy bill is worth in real terms:
One of the most important steps in making the move to renewable energy resources or even just saving yourself some money by cutting back is to figure out what you’re using now. Once you know that, you’ll know what you can do without and the more you can do without, the less you’ll have to generate on your own (and the less you’ll have to spend to buy the gear).I have been taking stock of what we have been spending the most money on energy wise in our house lately. Especially after I found out that things running on "stand-by" don't really use that much energy.
Here are some more real-life kilowatt hour examples from unplugged living (from sustainable energy blog):
A kWh of electricity means:Aside: I am hoping that "Santa" leaves me a Kill-a-Watt Meter under the tree. Then I can get to the bottom of what uses the most energy in the house.
- 1200 electric shaves (> 3 years)
- Slice 100 breads
- Drying your hair 15 times
- 4 TV evenings
- Listening to 15 CD's
- Using a (small) refrigerator for 24 hours
- 20 microwave meals
- Drill 250 holes
- 4 evenings of light with 60 W incandescent lamps
- 20 evening of light with 11 W compact fluorescent light
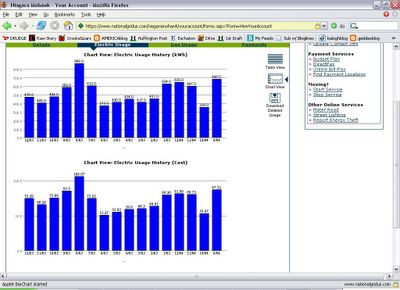
Related to energy efficiency, here is a great tool that I found that National Grid, our local energy utility provides to its customers online:

electricity use (click for enlargement)

It is a historical view of my electricity use over the last year. A good way to put it all in perspective. There is also a chart view available and the same chart and graph is available for natural gas use. The only complaint I have is that the current month is on the left hand side of the graph running back into your history of usage towards the right side. (Chronological graphs usually run the opposite direction.)
Two things you can quickly surmise from my graph: 1. That central AC unit uses a lot of power in the summer months* (but we already knew that), 2. We are doing a good job at reducing our energy use - November down 32% compared with Nov '04, and December '05 down 26% from the same month last year.
This tool will help positively reinforce the changes that we have been making to our home and in our lifestyles.
*I am of the mind that there are pleasures in life that should be taken advantage of while they are around. If, G-d forbid, peak oil comes quickly, I will have not regretted one day of central AC use in the summer. There will be plenty of sweltering summers to sweat through then... Besides, what this graph doesn't tell you is that all of our energy is from renewable sources - wind and small hydro.

0 Comments:
Post a Comment
<< Home